


-
- Trading Platforms
- PU Prime App
- MetaTrader 5
- MetaTrader 4
- PU Copy Trading
- Web Trader
- PU Social
-
- Trading Conditions
- Account Types
- Spreads, Costs & Swaps
- Deposits & Withdrawals
- Fee & Charges
- Trading Hours

EN
27 February 2025,08:00
Intermediate
27 February 2025, 08:00

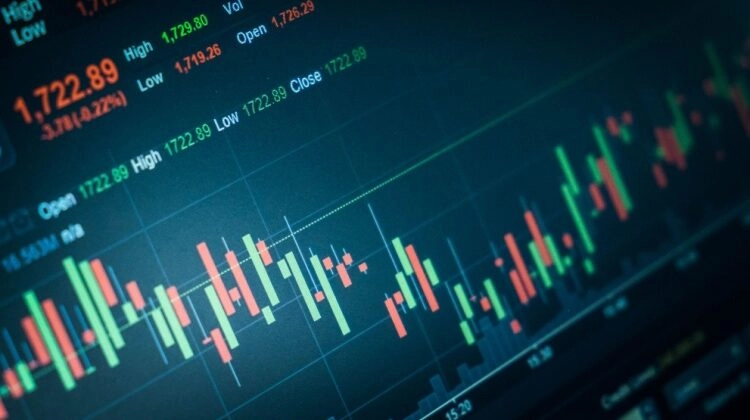
If you are a beginner trader, you must be wondering what candlesticks are and how they can help you in trading assets and more. Simply put, candlesticks are a type of technical analysis in trading that represents an asset’s opening, closing, high, and low prices over a specific period. They are incredibly useful and often form distinct patterns traders can use to predict an asset’s market sentiment and performance. If understood and interpreted correctly, the candlestick patterns can become a valuable asset to you in trading. There are a number of different candlestick patterns that reflect various market sentiments, and one such pattern is the Spinning top candlestick.
Spinning top candlesticks is an important pattern in the trading world. This pattern is famously known for hinting at possible trend reversals that traders can use to enter or exit trades and potentially make a profit. This candlestick shows a state of indecisiveness in the market where the sellers and the buyers are in a condition of “tug of war” with each other. This means that at the same time, the sellers are selling the asset and trying to bring its price down, whereas the buyers are buying the asset and trying to increase the price. The actions of both parties cause the formation of a spinning top candlestick in the price chart.
The reason that it is a key reversal pattern in trading is that after the buyers and the sellers are in a state of tug of war when one party pulls the rope, or the price of the asset in this condition, a little harder, a respective and potential bearish or bullish reversal can be seen. If the sellers win, a potential bearish reversal can be seen; if the buyers win, a bullish reversal can be seen. It is important here to notice that this is only a singular candlestick, and this pattern or its alleged signal holds the most power when it is used in conjunction with other technical analysis metrics and tools like other patterns, moving averages (MA), relative strength index (RSI), and more.
As explained earlier, there are many different types of patterns, each of which hints at specific market conditions and potential trend reversals. To understand and interpret these patterns correctly, in-depth knowledge of the asset, its properties, market sentiment, and general trading should be known. Otherwise, the pattern can be incorrectly anticipated, leading to potential loss. We recommend first learning and practising on demo accounts to counter this. Most major platforms offer these accounts and help beginner traders get accustomed to the trading world. They allow traders to trade in mimicked market conditions and environments without actual capital. This will help the traders become experienced in spotting and interpreting the patterns they can use to leverage in real-world trades.
There is a whole lot of information about the spinning top candlestick pattern, its identification, its bearish and bullish types, and more. So, in this article, we take you through everything you need to know about these types of candlesticks.
A spinning top candlestick is a type of candlestick that describes a state of indecisiveness in the market. This means the sellers and buyers try their best to bring the prices down and up but ultimately fail. This can be seen as a state of tug of war between them, and slight pressure from either side can put them in the winner’s seat. Visually, a spinning top candlestick has a unique shape. It has a short body that is perfectly and vertically placed between two shadows of equal sizes on either end.
Because of its unique shape, the pattern is referred to as a spinning top candlestick, as it looks like a child’s spinning top toy. The pattern is thus an indication of indecision in the market. As the seller and the buyer are trying their hands simultaneously, there is no clear winner; thus, no one has the upper hand. A spinning top candle is an important pattern, but what comes after is even more important because even a slight push from one side can bring about a trend reversal in the market. This makes this pattern so important and exciting to spot, interpret, and potentially act upon.
It is important to mention that these patterns are mere predictive signals and do not predict reversals. These signals need to be thoroughly confirmed by using different technical analysis tools and metrics. In addition, the trader’s prior market knowledge is also very important. Traders can start by looking at case studies, world news, and more to build knowledge about the assets and the factors affecting them.
The spinning top candlestick pattern represents a state of indecision in the market despite the buyers and sellers trying their best to bring the price action in their favour. This means that neither the buyers nor the sellers have the upper hand, but the ball can fall in their court with one strong push. Based on this, two main types of the spinning top candlestick pattern are important to understand. These types include bullish spinning top candlesticks and bearish spinning top candlestick patterns.
A bullish spinning top candlestick occurs after the asset’s price has steadily increased, but now, there is an equilibrium between selling and buying the asset. This type of candlestick, generally and by default, will have a green colour on most trading platforms. A bullish spinning top candlestick can indicate two important things: either there will be a reversal of the trend where the asset’s price will decrease, or the trend will continue, and the asset’s price will increase. The occurrence of one of the two possibilities will depend on the formation of the immediate next candle.
A strong red candle will form after the bullish spinning top candlestick in case of a potential reversal. It will indicate that the sellers have gained control over the price, and the trend is becoming bearish now and, thus, going in reverse. In case of a potential continuation of the signal, a strong green candle will form after the bullish spinning top candlestick, indicating that the buyers have regained control after a state of equilibrium.
A bearish spinning top candlestick occurs after the asset’s price has steadily decreased, but now, there is an equilibrium between selling and buying the asset. This type of candlestick, generally and by default, will have a red colour on most trading platforms. A bearish spinning top candlestick can indicate two important things: either there will be a reversal of the trend where the asset’s price will increase, or the trend will continue, and the asset’s price will decrease. The occurrence of one of the two possibilities will depend on the formation of the immediate next candle.
A strong green candle will form after the bearish spinning top candlestick in case of a potential reversal. It will indicate that the buyers have gained control over the price, and the trend is becoming bullish now and, thus, going in reverse. In case of a potential signal continuation, a strong red candle will form after the bearish spinning top candlestick, indicating that the sellers have regained control after a state of equilibrium.
It is important to note that these candlesticks may offer some insight into the market’s sentiment and may help you predict potential reversals. Still, they are just hints and need additional confirmation via different technical factors. Any technical pattern, when used in conjunction with other technical analysis tools, can be very beneficial for traders in making viable financial decisions.
The spinning top doji and the spinning top candlestick patterns are two different patterns that describe indecisiveness in the market and look very similar. Still, there are a few subtle differences between them. We know that the spinning top candle has a small body and a long shadow on either side, which shows that the sellers and buyers are at an equilibrium state, and a single strong push can cause a potential reversal in favour of either of the parties. However, the body is non-existent in a spinning top doji candlestick, representing that the asset’s opening and closing prices were nearly the same. This indicates that the buying and selling pressure is at an equilibrium state.
This is a minor but evident difference between the two candlesticks, and due to this difference, these patterns are interpreted slightly differently in the market. The spinning top doji candlestick pattern is a rare occurrence and shows a higher rate of indecision in the market than the spinning top candlestick pattern. Another important fact about the doji pattern is that a reversal is imminent here, whether bearish or bullish. Still, in the case of the spinning top pattern, a reversal may or may not be seen as the pattern can continue being bearish or bullish, depending on the immediate candle formation.
As a beginner trader, it can take some time to accurately identify chart patterns, which can sometimes be tricky. You can get started with the following steps to identify spinning tops in charts.
Every pattern is unique because of its shape, so you should start by spotting each pattern’s key features. To spot a spinning top candlestick, look for a small body that is present between two equally sized shadows on either side. A small body might be present in various instances, but it might also have differently sized shadows, so look for equally sized shadows.
Once you have spotted the unique body of the spinning top pattern, do your market research and figure out why or how the buying and selling pressure is in equilibrium. This will also help you understand why the candlestick is green or red. The important thing here is to do quick market research and understand the trend leading up to the spinning top candlestick because this will help you make the next decision.
The patterns that are based on a single candlestick, as well as the immediate next candlesticks, hold a lot of value. For example, imagine that you have positively identified a bearish candlestick but are waiting to confirm whether it will continue with the trend or will cause a potential reversal. The answer to these questions lies in the immediate next candlestick. If the bears take control of the situation, the next candle will be bearish, and the trend will continue to be bearish, but if the bulls take control, the next candle will be bullish, and a potential trend reversal will be seen.
As explained earlier, these candlestick patterns are mere signals or hints and should not be acted upon without further confirmation. This further confirmation can be conducted using various technical tools like moving averages, volume analyses, and Relative Strength Index (RSI).
There are quite a number of common misinterpretations of spinning top candlestick patterns. These misconceptions can affect the trading outcomes that the traders are looking for. Here we mention a few of these misconceptions:
This is wrong. Even though the spinning top candlestick pattern is a single figure, it has different types. Namely, bearish spinning top candlesticks and bullish spinning top candlesticks. It is commonly associated with the Doji candlestick pattern, but they are different patterns and portray slightly different market sentiments.
Spinning top candlestick signals do not validate possible trend reversals; they only hint at the possibility of one. Further technical analysis indicators are then used to validate possible trend reversals.
This is untrue. Not all spinning top candlestick signals mean that a possible trend reversal will occur. A few more market conditions go into validating a possible trend reversal, whether it is bearish or bullish.
These are only a few different misconceptions about the pattern. It is best to avoid them wherever possible and always do your due research and study before making any financial decisions in the trading market.
The spinning top candlestick pattern is a historically important pattern that originated in the 17th century as a part of the Japanese candlestick analysis toolkit. Japanese rice traders developed this toolkit to track the rise and fall in rice prices and how to best profit from them. Since then, the candlesticks have become a cornerstone of the trading world.
The spinning top term originated from the wooden children’s toy because of its close resemblance. The wooden toy spins on an unstable axis and, with time, falls down. The spinning top candlestick pattern is similarly unstable, and either falls down or rises up according to the action of the buyers and the sellers.
A spinning top indicates a state of indecisiveness in the trading market. This means that buyers and sellers are at equilibrium, and both parties are trying to gain control of the situation. A spinning top also indicates that a potential trend reversal may be on the horizon. Still, it can only be confirmed via the immediate candlesticks formed and various other technical analysis tools.
You can differentiate between a bullish and a bearish spinning top by looking at the trend leading up to the tops. A bullish spinning top candlestick occurs after the asset’s price has steadily increased, but now, there is an equilibrium between selling and buying the asset. This type of candlestick, generally and by default, will have a green colour on most trading platforms. A bearish spinning top candlestick occurs after the asset’s price has steadily decreased, but now, there is an equilibrium between selling and buying the asset. This type of candlestick, generally and by default, will have a red colour on most trading platforms.
Spinning top candlesticks is an important pattern in the trading world. This pattern is famously known for hinting at possible trend reversals that traders can use to enter or exit trades and potentially make a profit. This candlestick shows a state of indecisiveness in the market where the sellers and the buyers are in a condition of “tug of war” with each other. This means that at the same time, the sellers are selling the asset and trying to bring its price down, whereas the buyers are buying the asset and trying to increase the price. There are two types of candlestick: a bearish spinning top and a bullish spinning top candlestick.
It is important to note that these candlesticks may offer insight into the market’s sentiment and help you predict potential reversals. Still, they are just hints and need additional confirmation via different technical factors. To understand and interpret these patterns correctly, in-depth knowledge of the asset, its properties, market sentiment, and general trading should be known. For beginner traders, we recommend using and practicing on a demo account before making your way to the real-world trading markets.

Trade forex, indices, metal, and more at industry-low spreads and lightning-fast execution.
Sign up for a PU Prime Live Account with our hassle-free process.
Effortlessly fund your account with a wide range of channels and accepted currencies.
Access hundreds of instruments under market-leading trading conditions.
Trading Platforms
Learn
About PU Prime
Corporate

Please note the Website is intended for individuals residing in jurisdictions where accessing the Website is permitted by law.
Please note that PU Prime and its affiliated entities are neither established nor operating in your home jurisdiction.
By clicking the "Acknowledge" button, you confirm that you are entering this website solely based on your initiative and not as a result of any specific marketing outreach. You wish to obtain information from this website which is provided on reverse solicitation in accordance with the laws of your home jurisdiction.
Thank You for Your Acknowledgement!
Ten en cuenta que el sitio web está destinado a personas que residen en jurisdicciones donde el acceso al sitio web está permitido por la ley.
Ten en cuenta que PU Prime y sus entidades afiliadas no están establecidas ni operan en tu jurisdicción de origen.
Al hacer clic en el botón "Aceptar", confirmas que estás ingresando a este sitio web por tu propia iniciativa y no como resultado de ningún esfuerzo de marketing específico. Deseas obtener información de este sitio web que se proporciona mediante solicitud inversa de acuerdo con las leyes de tu jurisdicción de origen.
Thank You for Your Acknowledgement!