PU Prime App
Exclusive deals on mobile


PU Prime App
Exclusive deals on mobile
Hold The Global Markets In Your Hands
Our trading mobile app is compatible with most smart devices. Download the App now and start trading with PU Prime on any device, anytime and anywhere.


16 October 2024,05:39
Daily Market Analysis
16 October 2024, 05:39


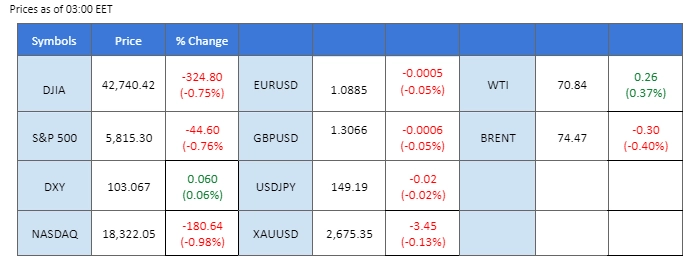
Market Summary
Wall Street saw a retracement in the last session, with a similar sentiment spreading to the Asian markets during the Tokyo session, where the Chinese equity market led the decline. This sell-off is believed to have been triggered by ASML, the world’s most advanced chip making machines manufacturer, missing its earnings target, indicating a potential slowdown in the global tech sector. Despite this, the U.S. equity market remains near its all-time highs, and traders are eagerly awaiting mega cap’s earnings reports to gauge future market direction.
Meanwhile, ongoing crossfire in the Middle East has fueled commodity prices, with gold rising steadily to near the $2,670 mark on heightened geopolitical risks. Oil prices, which had shown signs of bearish momentum, are stabilising as traders closely monitor developments in the region.
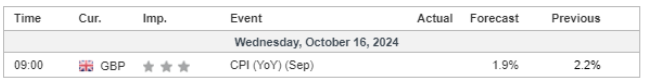
In the forex market, while the U.S. dollar held steady, attention has shifted to the Pound Sterling, with the UK CPI reading due today. Additionally, tomorrow’s ECB interest rate decision is anticipated to have a direct impact on the euro. In the crypto market, both BTC and ETH have surged sharply following news that both U.S. presidential candidates explicitly support the crypto sector, driving BTC to its highest level since July.
Current rate hike bets on 7th November Fed interest rate decision:
Source: CME Fedwatch Tool
-50 bps (7%) VS -25 bps (93%)
(MT4 System Time)
Source: MQL5
Market Movements
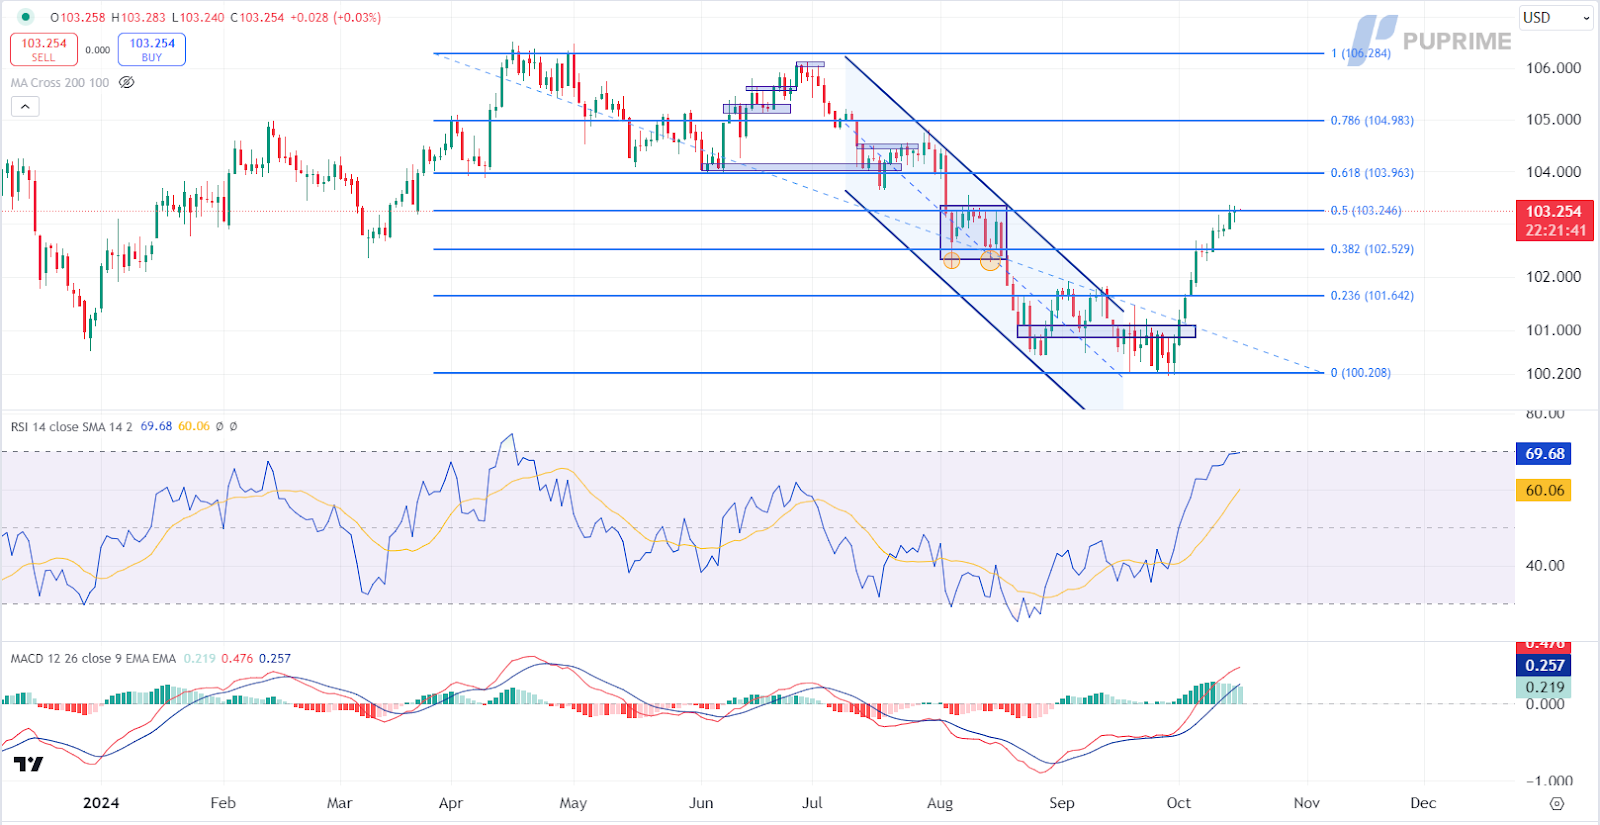
DOLLAR_INDX, H4
The Dollar Index, which measures the dollar against a basket of six major currencies, extended its gains. This movement is driven by investor expectations that recent strong U.S. economic data might prompt the Federal Reserve to implement smaller-than-expected rate cuts. The U.S. economy has shown resilience, with inflation rising slightly more than anticipated in September. While the Fed initiated an easing cycle with a 50-basis-point rate cut in September, market expectations have shifted toward a slower pace of cuts, further strengthening the dollar.
The Dollar Index is trading higher while currently testing the resistance level. However, MACD has illustrated diminishing bullish momentum, while RSI is at 70, suggesting the index might enter overbought territory.
Resistance level: 103.25, 103.95
Support level: 102.55, 101.65
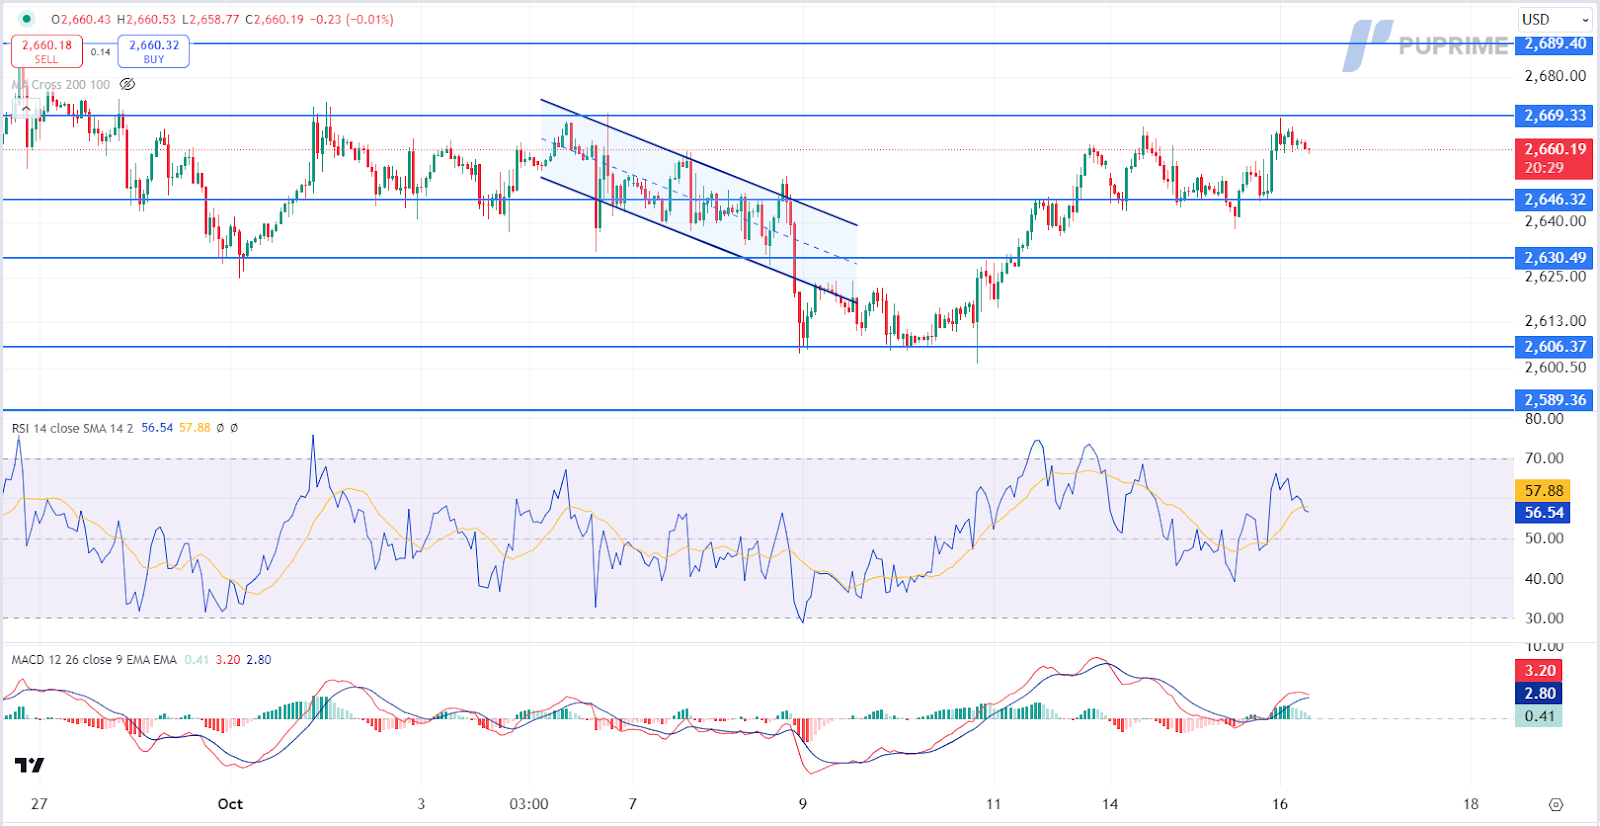
Gold prices remained in a consolidation phase near record highs, as investors adopted a cautious stance amid several impending events. Market volatility may stay elevated as the U.S. elections approach, alongside ongoing Middle East tensions. Despite the geopolitical backdrop, the U.S. dollar’s strength has capped gold’s gains, with recent strong economic reports tempering demand for the safe-haven asset. Investors should continue to watch these developments for potential trading signals.
Gold prices are trading lower following the prior retracement from the resistance level. MACD has illustrated diminishing bullish momentum, while RSI is at 57, suggesting the commodity might extend its losses since the RSI retreated sharply from overbought territory.
Resistance level: 2670.00, 2690.00
Support level: 2645.00, 2630.00
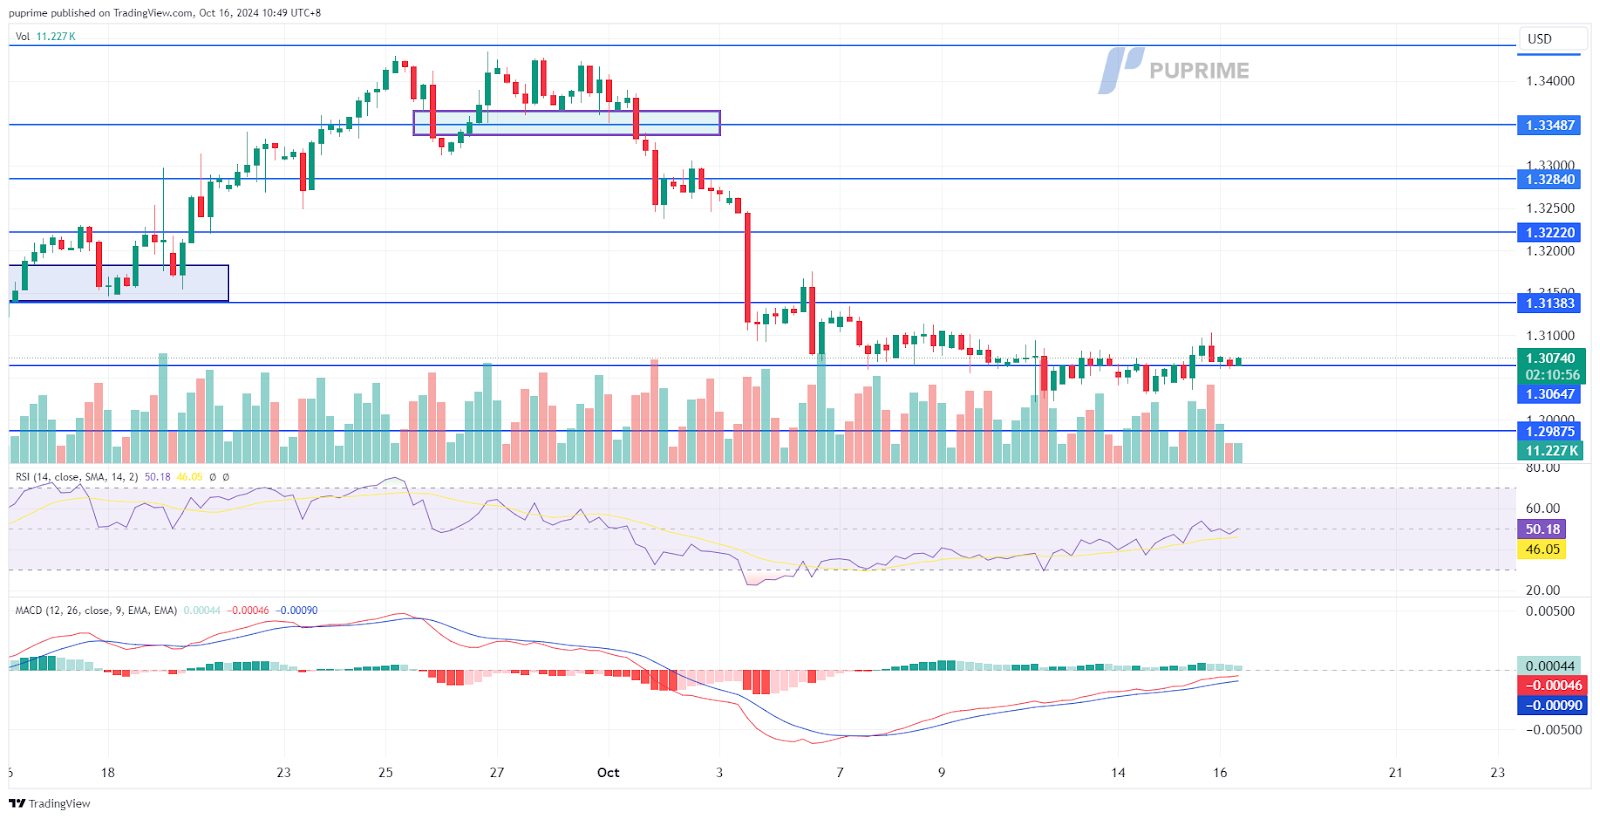
The GBP/USD pair has been trading sideways recently as both the U.S. dollar and Pound Sterling have lacked significant catalysts. However, the release of the UK’s CPI reading today is expected to directly impact Sterling’s strength and may provide the momentum needed for a breakout. At the same time, the bearish momentum appears to be easing. If the pair breaks above its current price consolidation range, it could signal a potential bullish trend reversal for the pair. Traders will be closely monitoring the data release to gauge the direction of the next move.
GBP/USD remains trading in a sideways manner, awaiting catalyst to pick a direction. S. If the pair is able to break above the 1.3105 mark, it may be a trend reversal signal because the RSI has risen to above 50 the level while the MACD is on the brink of breaking above the zero line, suggesting bearish momentum is vanishing.
Resistance level: 1.3140, 1.3220
Support level: 1.2990, 1.2910
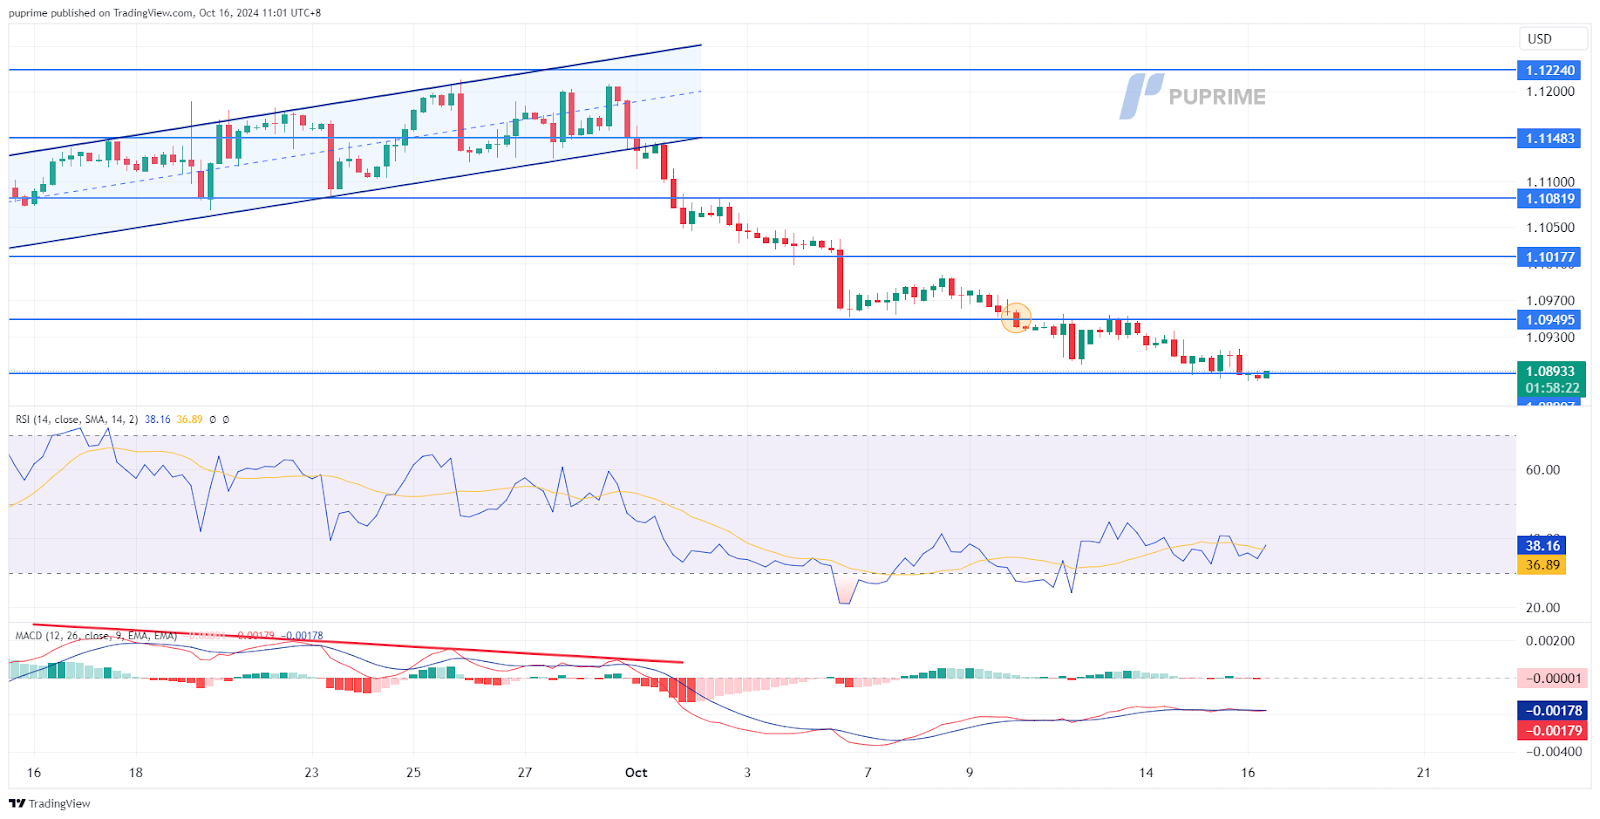
The EUR/USD pair continues to trade within its bearish trajectory as the euro remains under pressure from expectations of a dovish stance by the ECB due to recent lacklustre economic performance in the eurozone. With the ECB’s monetary policy decision due tomorrow, traders are anticipating significant movement in the pair. If the central bank decides to cut interest rates further, it could negatively impact the euro, leading to a potential decline in the EUR/USD pair. Market participants are closely watching the ECB’s decision, as it will likely shape the near-term direction of the pair.
EUR/USD has formed a lower-low price pattern, suggesting the pair remains bearish. The RSI remains below the 50 level, while the MACD hovers below the zero line, suggesting the pair remains trading with bearish momentum.
Resistance level: 1.0950, 1.1020
Support level: 1.08050, 1.0740
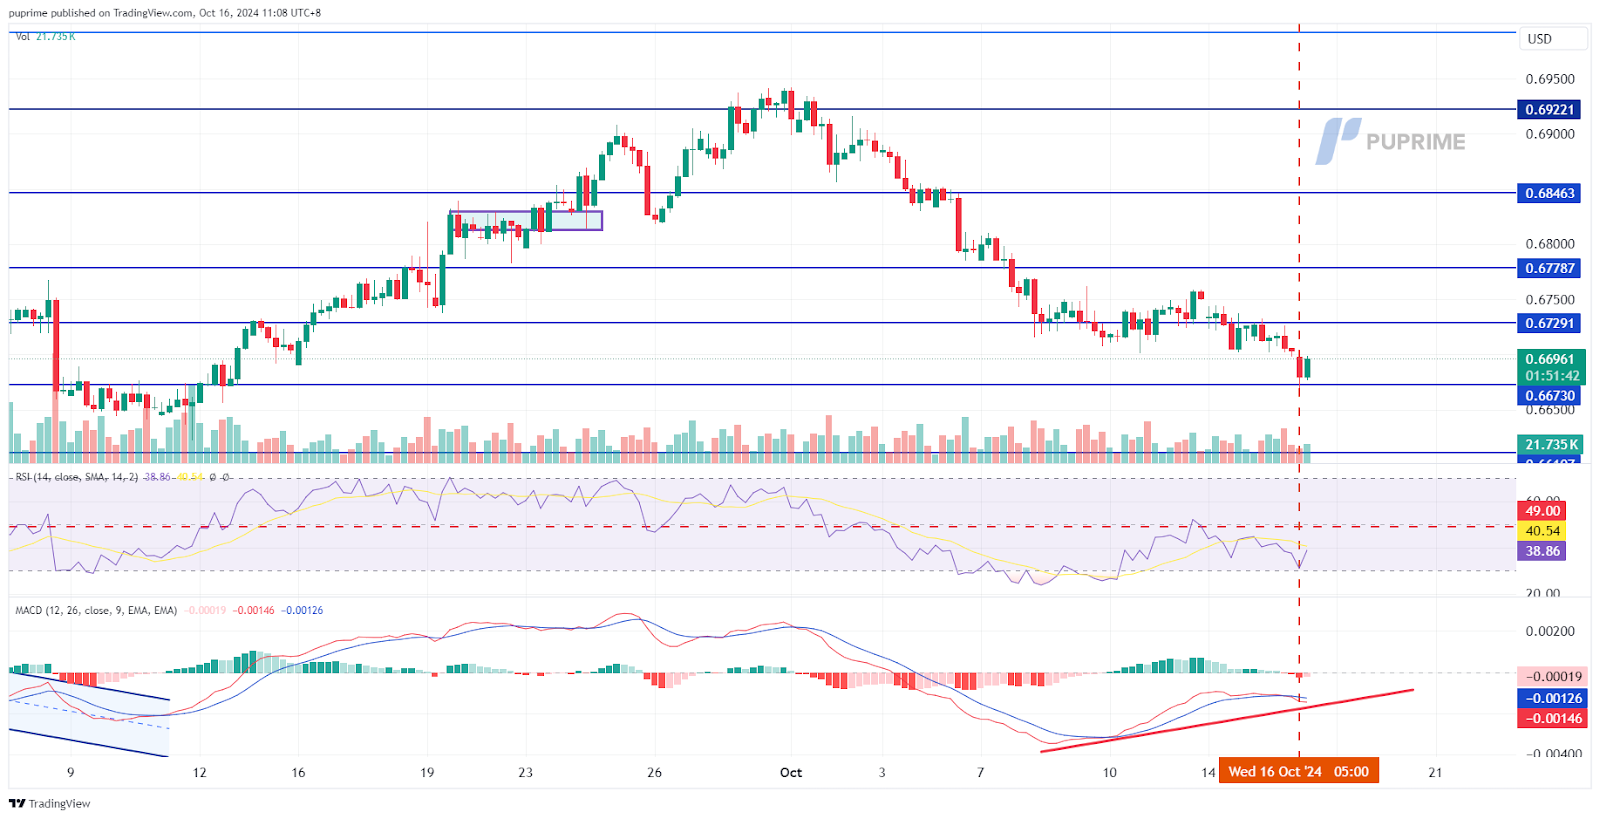
The AUD/USD pair has been weighed down by a strengthened U.S. dollar and the lacklustre Chinese economic performance, driving the pair to its lowest level in a month. As China is Australia’s largest trading partner, any slowdown in Chinese growth tends to impact the Australian dollar negatively. Aussie traders are now focusing on the upcoming Australian job data, particularly employment change and the unemployment rate, to assess the strength of the currency. Should the pair manage to break above its resistance level at 0.6730, it could signal a trend reversal and potentially lead to a recovery in the pair.
AUD/USD remains trading in a bearish manner, but the MACD has formed a bullish divergence, suggesting a potential trend reversal for the pair. The RSI, on the other hand, remains below the 50 level, suggesting the pair’s bearish momentum remains intact.
Resistance level: 0.6780, 0.6850
Support level: 0.6670, 0.6610
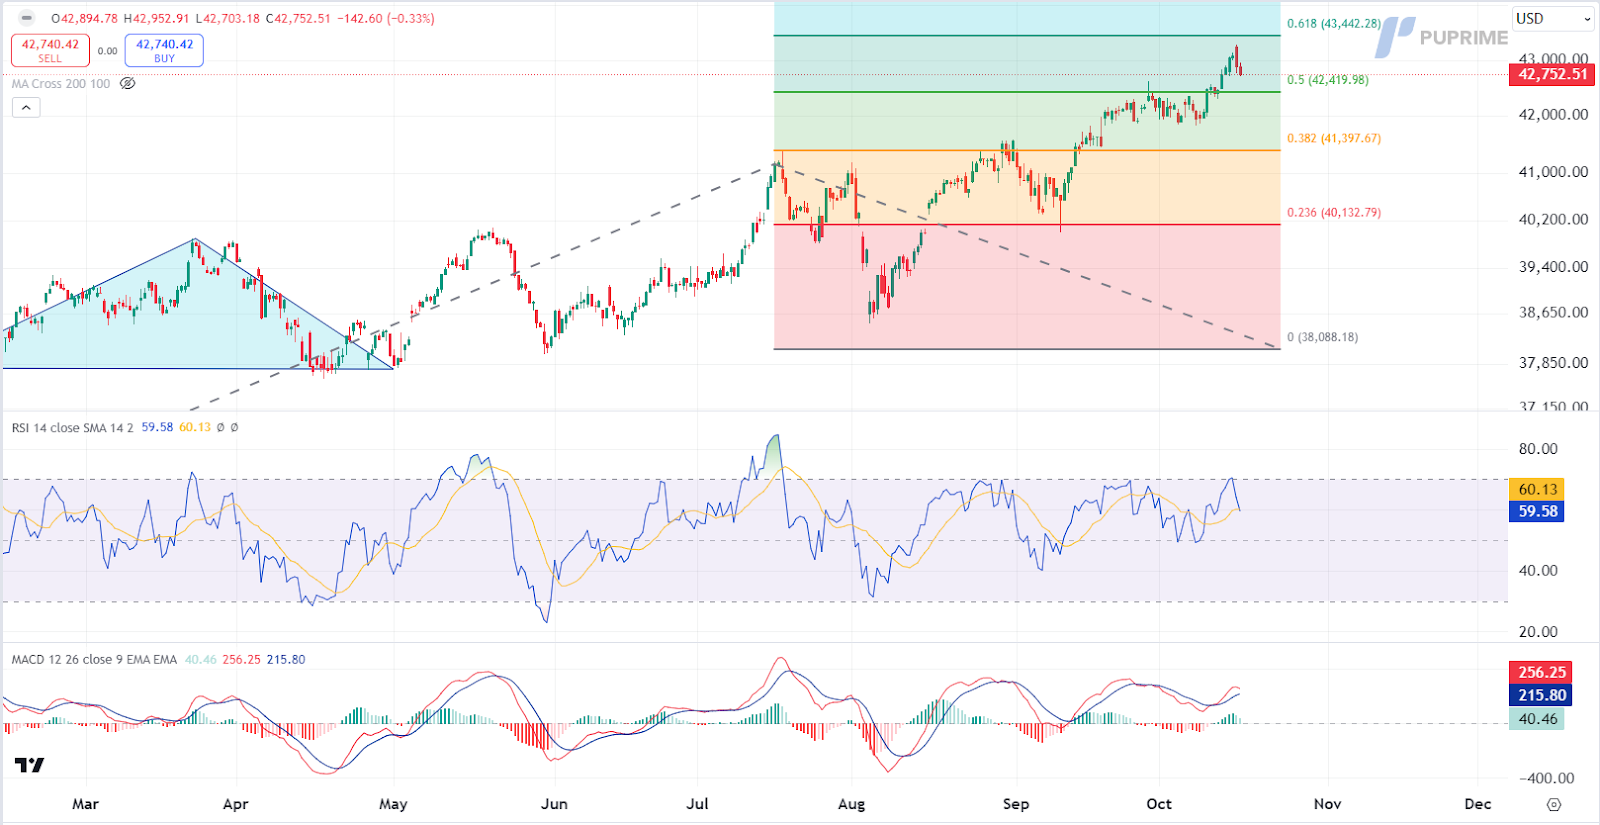
U.S. equities faced a selloff as concerns over tightening U.S. restrictions on chip sales and a disappointing forecast from Europe’s most valuable tech company dampened sentiment. Dow Jones declined 0.75% while the Nasdaq 100 fell 1.4%. Semiconductor stocks took a hit, with ASML Holding NV’s U.S.-traded shares plunging 16% after cutting its guidance for 2025. Nvidia Corp. also saw a 4.5% decline following reports that U.S. officials are considering capping sales of advanced AI chips to certain countries.
The Dow is trading lower following the prior retracement from the resistance level. MACD has illustrated diminishing bullish momentum, while RSI is at 60, suggesting the index might extend its losses since the RSI retreated sharply from overbought territory.
Resistance level: 43440.00, 44900.00
Support level: 42420.00, 41400.00
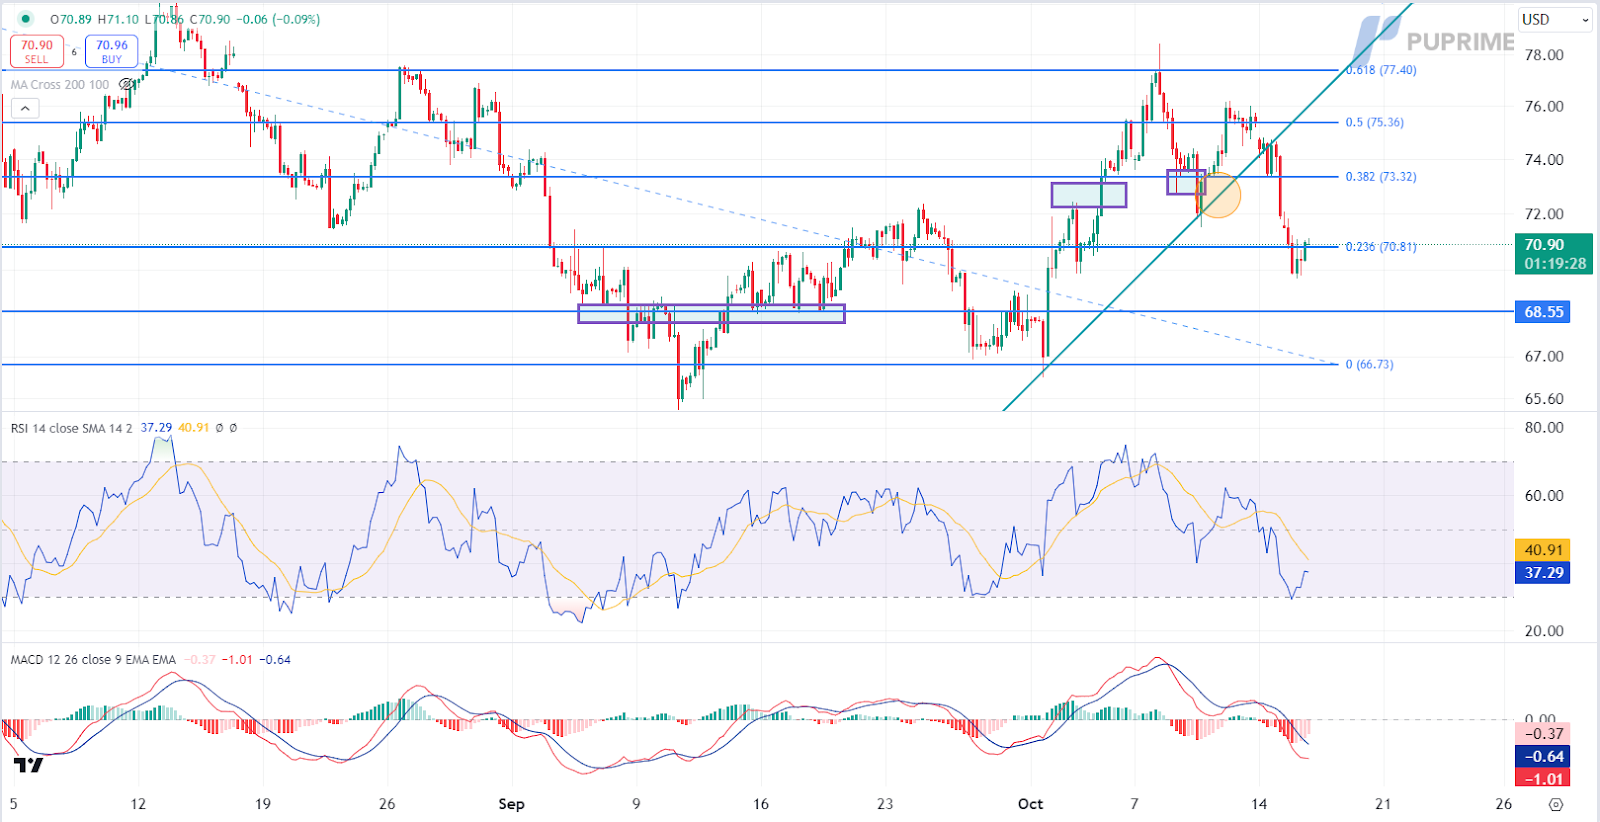
Crude oil prices dropped amid reports that Israel is unlikely to target Iranian oil sites, reducing fears of supply disruptions in the Middle East. Additionally, China reported its fifth consecutive monthly decline in oil imports, heightening concerns over weak demand. These concerns were compounded by OPEC’s downward revision of its oil demand forecast for the third consecutive month.
Oil prices are trading lower while currently testing the support level. However, MACD has illustrated diminishing bearish momentum, while RSI is at 37, suggesting the commodity might experience technical correction since the RSI rebounded sharply from oversold territory.
Resistance level: 73.30, 75.35
Support level: 70.80, 68.55

Trade forex, indices, metal, and more at industry-low spreads and lightning-fast execution.
Sign up for a PU Prime Live Account with our hassle-free process.
Effortlessly fund your account with a wide range of channels and accepted currencies.
Access hundreds of instruments under market-leading trading conditions.
Suite 201 Level 2, The Catalyst Building, 40 Silicon Avenue, Cybercity Ebene, Mauritius
Trading Platforms
Company
FAQs
PU Prime App - Start Trading with an Edge


Risk Warning: Trading Contract for Difference (CFD) carries a high level of risk to your capital and may result in losses that exceed your deposits due to leverage. It's important to understand how CFDs work and assess whether you can afford the high risk of losing your money. When acquiring our derivative products, you do not own or have rights in the underlying assets. Past performance is not indicative of future results. The information on this website is general and does not take into account your personal objectives, financial circumstances, or needs. Seek independent advice from qualified experts if necessary, and ensure you fully understand the risks before making any trading decisions.
PU Prime Ltd, is authorized and regulated by the Financial Services Authority of Seychelles under License No. SD050, with registered address CT House, Office 9A, Providence, Mahe, Seychelles.
Finzero Cap Ltd, registered in the Republic of Cyprus with registration number HE414308 and registered address at 62 Athalassas, Mezzanine, Strovolos, 2012, Nicosia, Cyprus.
Finzero Cap Ltd facilitates services to the licensed and regulated entities within the PuPrime Organizational structure, including but not limited to payment services.
PU Prime Ltd is authorized and regulated by the Financial Services Commission of Mauritius under License No. GB23202672, with registered address at Suite 201 Level 2, The Catalyst Building, 40 Silicon Avenue, Cybercity Ebene, Mauritius.
The information on this website is not intended for residents of certain jurisdictions, including the United States, Singapore, Australia, China, Pakistan and jurisdictions listed on the FATF and EU/UN sanctions lists. It is not intended for distribution or use where such distribution or use would be contrary to local law or regulation. While the Authority has granted a securities or derivatives investment business licence to the Licensee, it does not endorse the products offered.
Copyright © 2024 PU Prime.

Please note the Website is intended for individuals residing in jurisdictions where accessing the Website is permitted by law.
Please note that PU Prime and its affiliated entities are neither established nor operating in your home jurisdiction.
By clicking the "Acknowledge" button, you confirm that you are entering this website solely based on your initiative and not as a result of any specific marketing outreach. You wish to obtain information from this website which is provided on reverse solicitation in accordance with the laws of your home jurisdiction.
Thank You for Your Acknowledgement!
Ten en cuenta que el sitio web está destinado a personas que residen en jurisdicciones donde el acceso al sitio web está permitido por la ley.
Ten en cuenta que PU Prime y sus entidades afiliadas no están establecidas ni operan en tu jurisdicción de origen.
Al hacer clic en el botón "Aceptar", confirmas que estás ingresando a este sitio web por tu propia iniciativa y no como resultado de ningún esfuerzo de marketing específico. Deseas obtener información de este sitio web que se proporciona mediante solicitud inversa de acuerdo con las leyes de tu jurisdicción de origen.
Thank You for Your Acknowledgement!
